NFL Week 6 Betting Recap: Point Spread, Over/Under Results & Analysis (2020)
October 20, 2020 – by Jason Lisk
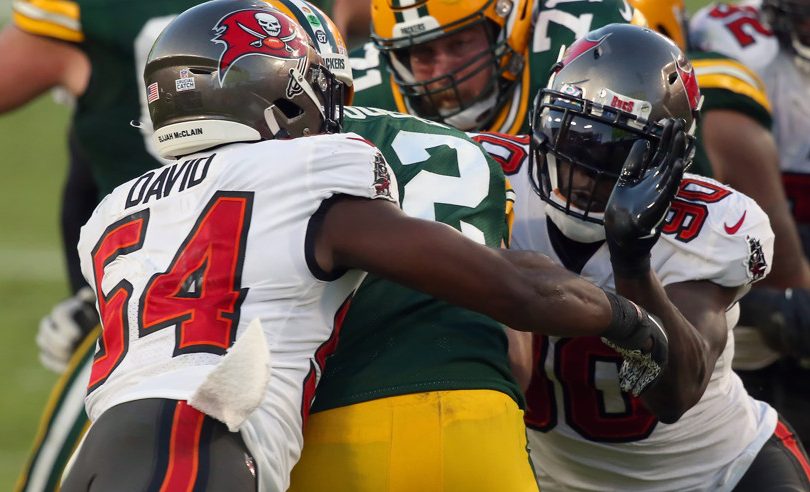
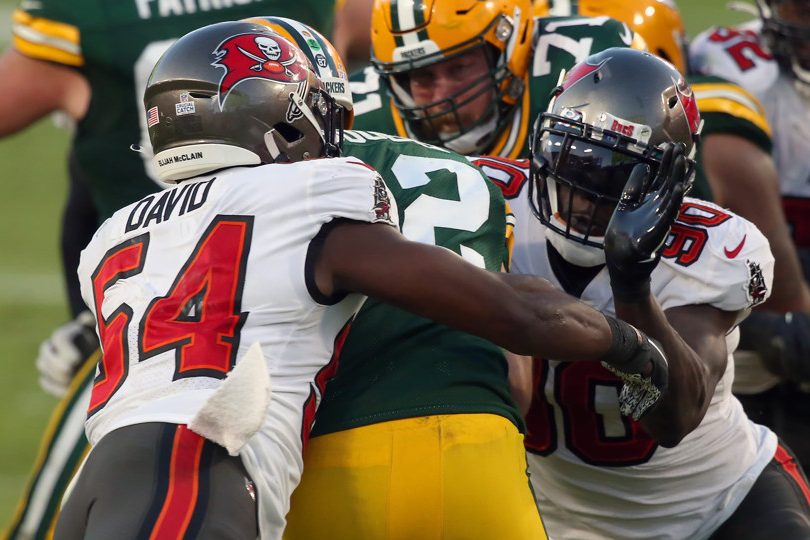
The Tampa Bay Buccaneers shut down the Green Bay Packers (Photo by Cliff Welch/Icon Sportswire)
NFL Week 6 saw some top defensive performances in a year where scoring has been off the charts. Some examples:
The Tampa Bay Buccaneers held the Green Bay Packers, who were averaging 38 points/game coming in, to 201 yards and 10 points.The Pittsburgh Steelers allowed the Cleveland Browns only 12 first downs and 220 total yards, while giving up only 7 points.Miami shut out the New York Jets, the first shutout for the franchise since November of 2014.Denver went into New England and held the Patriots to 12 points, winning a game where the Broncos kicked six field goals and had no touchdowns themselves.Arizona had four takeaways in the 38-10 win over Dallas, in the Cowboys’ first game without Dak Prescott.
In this post, we’ll dig into the data to examine not only how teams performed against the point spread and over/under lines in Week 6, but also review some of the fluky, improbable outcomes that can make ATS records misleading.
This level of analysis often provides clues as to which teams may be setting up well to cover the spread in the future.
(To search for your own NFL betting trends, we invite you to use the beta version of our BetIQ Trend Finder Tool.)
NFL Week 1 Picks
Betting – Survivor – Pick’em
Start Free TrialGet The Season
NFL Week 6 By the Betting Numbers
Biggest upset: Denver over New England (+7, +296 money line)Biggest ATS cover margin: Tampa Bay over Green Bay (+31, won by 28 points as 3-point underdog)Most points above over/under line: Tennessee-Houston (+26, 78 total points vs. O/U line of 52.0)Most points below over/under line: Miami-NY Jets (-22, 24 total points vs. O/U line of 46.0)Most points scored vs. team expectation: Tennessee (42 points vs. 28.0 expected)Fewest points scored vs. team expectation: Green Bay (10 points vs. 29.0 expected)
Houston Goes for Two, Loses by More Than 4
Having Houston +4 against Tennessee was probably the better side of it, but things didn’t work out late for the cover. Houston, already up by 1, scored a touchdown just inside the two-minute warning. But from that point on, everything went wrong.
Interim head coach Romeo Crennel opted to go for two to try to guarantee the victory, in a game where both offenses had already scored 30 points. That decision is justifiable, though not clear cut, and comes down to whether you trust your own offense to score or your defense to stop a two-point attempt (if the Titans scored).
With the average NFL two-point conversion rate right around 50%, and with both offenses doing well, it was certainly understandable.
Unfortunately for Texans backers, it set the stage for a bad beat. Houston, up by 7 after the failed conversion, gave up a last-second TD to Tennessee to tie it. Then, the Titans won the toss, and went down the field and scored again, so that Houston never saw the ball again after that failed conversion. The Texans went from up 7 (and potentially up 8) with less than two minutes to play, to a 6-point loss and the non-cover.
The Jets Remain Perfect (Perfectly Bad ATS, That Is)
The New York Jets dropped to 0-6 while also maintaining a perfect 0-6 record against the spread. And they did so in style, scoring zero points.
It’s fairly astonishing that Adam Gase is still the Jets head coach, but we may be in a situation where the franchise ps the best way to secure the top overall pick is by keeping him around.
The Jets’ double of going without a win both against the spread and straight up had us wondering, so we had to check. Going back to 1985, there are only six other teams that started 0-6 while not covering the spread in any of the losses. So the Jets’ start is not completely unprecedented:
Teams that started 0-6 with no covers against the spread
| Year | Team | W | L | W (ATS) | L (ATS) | T (ATS) | |
|---|---|---|---|---|---|---|---|
| 2011 | St. Louis | 2 | 14 | 3 | 12 | 1 | |
| 1998 | Washington | 6 | 10 | 7 | 9 | 0 | |
| 2011 | Miami | 6 | 10 | 9 | 6 | 1 | |
| 1989 | Dallas | 1 | 15 | 6 | 10 | 0 | |
| 1991 | Indianapolis | 1 | 15 | 5 | 11 | 0 | |
| 1991 | Cincinnati | 3 | 13 | 4 | 12 | 0 |
The teams in the table above averaged 3.2 wins, while covering the spread 57.5% of the time for the rest of the season. So the lines could eventually catch up to the Jets and provide some value later in the season, assuming Gase doesn’t continue to find new ways to make the team worse.
NFL Home Field Advantage in 2020
One of the things we are tracking this year is how home teams are performing, with many teams playing in front of no fans to start the year. In Week 6, home teams went 7-7 straight up and 6-8 ATS.
Weekly NFL Home Team Records, 2020 Season To Date
| Week | W | L | T | WIN PCT | ATS W | ATS L | ATS T | ATS PCT |
|---|---|---|---|---|---|---|---|---|
| 1 | 8 | 8 | 0 | 50.0% | 9 | 7 | 0 | 56.3% |
| 2 | 11 | 5 | 0 | 68.8% | 8 | 8 | 0 | 50.0% |
| 3 | 6 | 9 | 1 | 40.6% | 7 | 9 | 0 | 43.7% |
| 4 | 6 | 9 | 0 | 30.8% | 5 | 10 | 0 | 33.3% |
| 5 | 9 | 5 | 0 | 61.5% | 6 | 8 | 0 | 42.9% |
| 6 | 7 | 7 | 0 | 50.0% | 6 | 8 | 0 | 42.9% |
| Overall | 47 | 43 | 1 | 52.2% | 41 | 50 | 0 | 45.6% |
However, last year, home teams were only 45.0% SU and 38.3% ATS in the first six weeks of the season, performing even worse than this year.
Over the previous five seasons (2015-2019), home teams have won 54.5% SU and 47.3% ATS in the first six weeks. So home teams having a sub-50% ATS record so far in 2020 still doesn’t buck any recent historical trend.
2020 Point Spread Result Splits
Here’s how some of the more standard spilts look after Week 6:
| TYPE | ATS W | ATS L | ATS T | ATS % |
|---|---|---|---|---|
| Favorites | 42 | 49 | 0 | 46.2% |
| Underdogs | 49 | 42 | 0 | 53.8% |
| Home Teams | 41 | 50 | 0 | 45.1% |
| Away Teams | 50 | 41 | 0 | 54.9% |
2020 Scoring vs. Historical Seasons
Scoring continued to regress back a bit in Week 6, though it is still higher than recent past seasons. Ten of 14 games went under the number and games averaged fewer than 50 points scored for the week.
Overs are now 47-43-1 on the season (52.2%). So while scoring is up, the over/under betting market has effectively caught up with that increase, and unders have been profitable for the last two weeks.
Here’s a running tally of how overall NFL scoring so far in 2020 compares to the full season averages of recent seasons, based on average total points scored per game:
| 2020 | 2019 | 2018 | 2017 | 2016 |
|---|---|---|---|---|
| 49.4 | 45.6 | 46.7 | 43.4 | 45.6 |
Turnovers, Miscues & Failures: Week 6 Edition
In this section each week, we list a summary of drives that ended with turnovers, but not only official turnovers like interceptions and fumbles.
We also tally up other high-leverage events that likely led to either loss of points or great field position for an opponent. Safeties and blocked punts are included in turnovers, and blocked field goals are included in missed field goal attempts.
Week 6 Team ATS Records Based On Turnovers, Missed Field Goals, and Failed 4th Down Attempts
| Team | Turnovers | FG Miss | Downs | TOTAL | ATS Result |
|---|---|---|---|---|---|
| Carolina | 3 | 1 | 1 | 5 | Lost |
| Cleveland | 2 | 0 | 3 | 5 | Lost |
| Dallas | 4 | 1 | 0 | 5 | Lost |
| Jacksonville | 2 | 1 | 2 | 5 | Lost |
| Minnesota | 3 | 0 | 1 | 4 | Lost |
| New England | 3 | 0 | 1 | 4 | Lost |
| Philadelphia | 1 | 1 | 2 | 4 | Won |
| Tennessee | 2 | 2 | 0 | 4 | Won |
| NY Jets | 1 | 1 | 1 | 3 | Lost |
| Washington | 2 | 1 | 0 | 3 | Won |
| Buffalo | 1 | 1 | 0 | 2 | Lost |
| Green Bay | 2 | 0 | 0 | 2 | Lost |
| Indianapolis | 2 | 0 | 0 | 2 | Lost |
| Cincinnati | 1 | 1 | 0 | 2 | Won |
| Denver | 2 | 0 | 0 | 2 | Won |
| Detroit | 1 | 1 | 0 | 2 | Won |
| Miami | 2 | 0 | 0 | 2 | Won |
| LA Rams | 1 | 0 | 0 | 1 | Lost |
| NY Giants | 1 | 0 | 0 | 1 | Lost |
| Atlanta | 1 | 0 | 0 | 1 | Won |
| Chicago | 1 | 0 | 0 | 1 | Won |
| Kansas City | 1 | 0 | 0 | 1 | Won |
| Baltimore | 0 | 0 | 0 | 0 | Lost |
| Houston | 0 | 0 | 0 | 0 | Lost |
| Arizona | 0 | 0 | 0 | 0 | Won |
| Pittsburgh | 0 | 0 | 0 | 0 | Won |
| San Francisco | 0 | 0 | 0 | 0 | Won |
| Tampa Bay | 0 | 0 | 0 | 0 | Won |
Teams with 4 or more turnovers, missed field goals or failed attempts went 2-6 ATS. The two wins were the Titans, who came back and covered as a favorite when trailing by 7 late, and the Eagles, who had two failed fourth down attempts, a turnover, and a missed field goal and still came within a two-point conversion of tying the Baltimore Ravens.
Teams that had zero drives end in those events went 4-2 ATS, with the two spread losses being the aforementioned Texans and Ravens.
Drive-Ending Miscues By Team: 2020 Season Tally
Here’s a summary of the full season so far showing the net number of drives ending in turnovers or miscues for each team.
The top of this list, where teams have created more turnovers or benefited from more miscues, features a lot of teams with winning spread records. On the other end, the Dallas Cowboys are dead last in both turnovers and turnovers forced, which contributes to an 0-6 record ATS.
2020 Season Summary, Drives Ending in Turnovers or Other Failed Plays
| Team | Mistakes | Opponent | Net | ATS Record |
|---|---|---|---|---|
| Baltimore | 8 | 24 | 16 | 3-2-1 |
| Pittsburgh | 4 | 16 | 12 | 4-1 |
| Seattle | 5 | 16 | 11 | 4-1 |
| Miami | 8 | 18 | 10 | 4-2 |
| Tampa Bay | 9 | 16 | 7 | 3-2-1 |
| Kansas City | 7 | 14 | 7 | 4-2 |
| Green Bay | 5 | 9 | 4 | 4-1 |
| Chicago | 11 | 15 | 4 | 4-2 |
| Arizona | 9 | 13 | 4 | 4-2 |
| Tennessee | 8 | 11 | 3 | 2-3 |
| Cincinnati | 11 | 14 | 3 | 4-2 |
| New Orleans | 4 | 7 | 3 | 2-3 |
| Atlanta | 11 | 14 | 3 | 2-4 |
| LA Rams | 10 | 12 | 2 | 3-3 |
| Houston | 8 | 10 | 2 | 1-5 |
| Buffalo | 12 | 11 | -1 | 3-3 |
| Detroit | 8 | 7 | -1 | 2-3 |
| New England | 14 | 11 | -3 | 2-3 |
| Washington | 15 | 12 | -3 | 2-3-1 |
| Indianapolis | 12 | 9 | -3 | 3-3 |
| San Francisco | 14 | 11 | -3 | 3-3 |
| NY Giants | 13 | 10 | -3 | 3-3 |
| NY Jets | 16 | 12 | -4 | 0-6 |
| LA Chargers | 10 | 6 | -4 | 3-1-1 |
| Denver | 16 | 12 | -4 | 4-1 |
| Las Vegas | 8 | 3 | -5 | 3-2 |
| Cleveland | 15 | 9 | -6 | 3-3 |
| Carolina | 13 | 5 | -8 | 3-3 |
| Jacksonville | 19 | 10 | -9 | 2-4 |
| Minnesota | 15 | 5 | -10 | 3-3 |
| Philadelphia | 18 | 7 | -11 | 2-4 |
| Dallas | 19 | 3 | -16 | 0-6 |
2020 NFL ATS & Over/Under Performance By Team
Finally, here are updated against the point spread and over/under records so far in 2020. You can check out more trends on our BetIQ NFL betting trends page.
2020 NFL ATS and O/U Records
| Team | W | L | T | Streak ATS | Over | Under | Push | O/U Streak |
|---|---|---|---|---|---|---|---|---|
| Arizona | 4 | 2 | 0 | W2 | 0 | 6 | 0 | U6 |
| Atlanta | 2 | 4 | 0 | W1 | 4 | 2 | 0 | O1 |
| Baltimore | 3 | 3 | 0 | L1 | 2 | 4 | 0 | O1 |
| Buffalo | 3 | 3 | 0 | L2 | 4 | 1 | 1 | U1 |
| Carolina | 3 | 3 | 0 | L1 | 2 | 4 | 0 | U4 |
| Chicago | 4 | 2 | 0 | W2 | 2 | 4 | 0 | U3 |
| Cincinnati | 4 | 2 | 0 | W1 | 3 | 3 | 0 | O1 |
| Cleveland | 3 | 3 | 0 | L1 | 4 | 2 | 0 | U1 |
| Dallas | 0 | 6 | 0 | L6 | 4 | 2 | 0 | U1 |
| Denver | 4 | 1 | 0 | W2 | 2 | 3 | 0 | U1 |
| Detroit | 2 | 3 | 0 | W1 | 3 | 2 | 0 | U1 |
| Green Bay | 4 | 1 | 0 | L1 | 3 | 2 | 0 | U2 |
| Houston | 1 | 5 | 0 | L1 | 4 | 2 | 0 | O1 |
| Indianapolis | 3 | 3 | 0 | L2 | 3 | 3 | 0 | O2 |
| Jacksonville | 2 | 4 | 0 | L4 | 3 | 3 | 0 | U2 |
| Kansas City | 4 | 2 | 0 | W1 | 2 | 4 | 0 | U1 |
| LA Chargers | 4 | 1 | 0 | W2 | 2 | 3 | 0 | O2 |
| LA Rams | 3 | 3 | 0 | L1 | 2 | 4 | 0 | U3 |
| Las Vegas | 3 | 2 | 0 | W1 | 4 | 0 | 1 | O1 |
| Miami | 4 | 2 | 0 | W2 | 2 | 4 | 0 | U1 |
| Minnesota | 3 | 3 | 0 | L1 | 4 | 2 | 0 | O1 |
| New England | 2 | 3 | 0 | L2 | 2 | 3 | 0 | U2 |
| New Orleans | 2 | 3 | 0 | L1 | 5 | 0 | 0 | O5 |
| NY Giants | 3 | 3 | 0 | L1 | 2 | 4 | 0 | U1 |
| NY Jets | 0 | 6 | 0 | L6 | 3 | 3 | 0 | U2 |
| Philadelphia | 2 | 4 | 0 | W1 | 4 | 2 | 0 | O2 |
| Pittsburgh | 4 | 1 | 0 | W3 | 3 | 2 | 0 | U1 |
| San Francisco | 3 | 3 | 0 | W1 | 3 | 3 | 0 | U1 |
| Seattle | 4 | 1 | 0 | L1 | 4 | 1 | 0 | O1 |
| Tampa Bay | 3 | 3 | 0 | W1 | 3 | 3 | 0 | U2 |
| Tennessee | 2 | 3 | 0 | W2 | 4 | 1 | 0 | O4 |
| Washington | 3 | 3 | 0 | W1 | 3 | 3 | 0 | U2 |
Other Recent Betting Articles on TeamRankings
NFL Betting: The Miami Dolphins Go from Big Underdogs to Big Favorites
NFL Betting: Key Numbers for NFL Teasers
NFL Betting: Using Game Totals and Point Spreads to Inform Passing Yard Prop Bets
NFL Betting: ATS Performance Of West Coast Teams Going East (Travel Impact)
NFL Betting: Do Home Teams Have An Edge In Thursday Night Football?
NFL Betting: How Much Are Injuries To Star Running Backs Really Worth?
NFL Betting: Does Denver Have An Early Season ATS Advantage?
NFL Week 1 Picks
Betting – Survivor – Pick’em
Start Free TrialGet The Season
If you liked this post, please share it. Thank you! Twitter Facebook
NFL Football Pool Picks NFL Survivor Pool Picks NCAA Bracket Picks College Bowl Pool Picks College Football Pool Picks NFL Picks NBA Picks MLB Picks College Football Picks College Basketball Picks NFL Predictions NBA Predictions MLB Predictions College Football Predictions College Basketball Predictions NFL Spread Picks NBA Spread Picks MLB Spread Picks College Football Spread Picks College Basketball Spread Picks NFL Rankings NBA Rankings MLB Rankings College Football Rankings College Basketball Rankings NFL Stats NBA Stats MLB Stats College Football Stats College Basketball Stats NFL Odds NBA Odds MLB Odds College Football Odds College Basketball Odds A product ofTeamRankings BlogAboutTeamJobsContact
© 2005-2024 Team Rankings, LLC. All Rights Reserved. Statistical data provided by Gracenote.
TeamRankings.com is not affiliated with the National Collegiate Athletic Association (NCAA®) or March Madness Athletic Association, neither of which has supplied, reviewed, approved or endorsed the material on this site. TeamRankings.com is solely responsible for this site but makes no guarantee about the accuracy or completeness of the information herein.
Terms of ServicePrivacy Policy